Summary: Being able to monitor a team's productivity over time is crucial for predicting possible bottlenecks, forecasting trends, and effectively managing workload and review processes - especially when projects involve multiple collaborators and many layers of review and approval.
Ziflow brings these insights to your fingertips by tracking core metrics around creative production.
This article outlines how described functionality appears and operates in the old layout. If you are using Dashboard 2.0, please refer to the corresponding article in the Help Center.
Available for: Admins and Managers on Standard, Pro, Business Legacy, and Enterprise editions.
Where is the feature setup? The insights tab is located in the top left of your Ziflow dashboard.

How does it work?
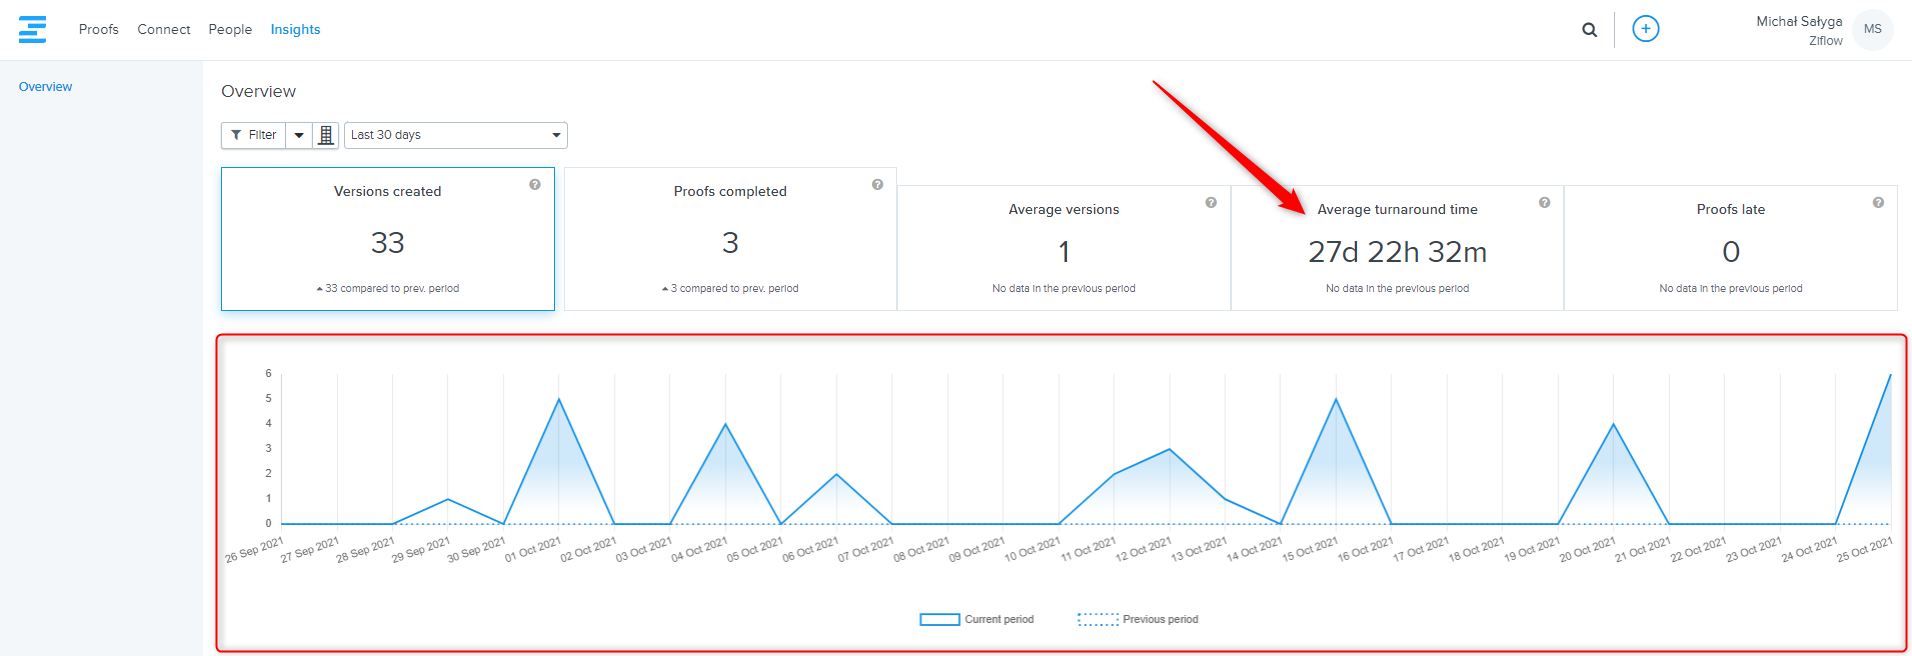
Once you open the Insights tab, you will see an overview of the data collected throughout the entire account.

1. Filter - by adding your own filters, you can decide which proofs should count towards your statistics. This will allow you to get more thorough information on your proof work. You can use the same filters as in your Proof List view.
2. Time period selector - this setting lets you choose a time period of data collection. There are a few pre-set options: 7, 30, 60, 90, and 120 days, or you can set your own custom time frame.
3. Data type - there are five types of data that you can check in the Insights module:
Versions created - number of versions created within the selected time period.
Proofs completed - Number of Proofs completed (Approved or Approved with Changes) within the selected time period.
Average versions - Average number of versions per proof for all completed proofs (Approved or Approved with Changes) within the selected time period.
Average turnaround time - Average number of versions per proof for all completed proofs (Approved or Approved with Changes) within the selected time period.
Proofs late - Number of completed proofs (Approved or Approved with Changes) that had at least one late version within the selected time period.
4. Graph - this represents one of the selected values, both for the selected period and the previous period of time.
Once you select a time period, you can switch between data types by clicking on them; this way, the graph will also be amended with the correct information.