Every discipline in marketing has core KPIs that need to be monitored. From impressions and conversion rates to customer acquisition costs, it all adds up to influence how you form your strategy, campaigns, and even your teams.
What is often missing from these views are creative production metrics: the measurement of production steps and tasks it takes to produce creative assets of any medium for a business project.
This is largely due to the fact that producing materials is more like a fire hose of demands that creative teams are always trying to keep up with. It’s tough to track how day-to-day tasks impact your project’s and team’s bottom line when it’s raining revisions and changing priorities.
What we'll cover
Table of contents
Why you need to track creative metrics
Creative production should be measured just as closely as your core marketing metrics, especially considering the costs involved - people, materials, and especially opportunity costs.
By regularly monitoring metrics for creative production, marketing leaders can identify bottlenecks, ensure alignment between projected timelines and actual outputs, and make informed decisions about resource allocation. This data-driven approach ensures that creative teams are better equipped to manage the overwhelming backlog of projects and avoid burnout.
Based on discussions with our customers, in both the agency and brand setting, and input from our own creative team, we've identified the three key metrics that every creative professional (and creative project manager) should have on demand, in real-time: production turnaround time, the total volume of project versions, and process management costs
1. Production Turnaround Time
Projected production timelines and actual creative production timelines can be two wildly different things. You may know, on average, how long it takes your team to complete certain types of projects, but within that, you should be tracking:
- Initial Creative Production Timelines: How long does it take your team to produce a first draft for review, from brainstorm to copy to design to layout?
- Time to “First Touch”: How long does it take your reviewers to actually first engage with a new review request?
- Internal and External Reviewer Turnaround Timelines: How long does it take your internal team members to review proofs and provide all feedback on creative content? How long does it take your clients to send their feedback and sign off that revisions are ready to be made into a new draft?
- Total Time to Completion: Adding these steps together, what’s the total product lifecycle for your creative team?
Why Track Production Timelines
Primarily, production timelines dictate your team’s overall capacity at any given time. It helps you identify the why of process bottlenecks rather than just identifying where they happen. With this knowledge, you can:
- Ensure that the timelines you’re quoting clients lining up with the reality of your team’s output,
- Plan workload for scale and measure potential new business against internal resources and capacity planning.
- Understand which areas of business require the investment of additional resources (headcount, technology, process automation) to complete projects on time.
However, there’s another important aspect to turnaround time that shouldn’t be overlooked, and that’s whether or not the complexity of the tools used, or the processes followed, have caused turnaround times to drag. Sifting through emails for feedback is one culprit, hard-to-use or feature incomplete proofing tools is another.
How to Track Production Turnaround Timelines
Your enterprise-ready online proofing system should be able to identify the project start and approval time spans for content types, or at least provide that data for extraction. In the absence of a centralized review and approval system, you can combine data points such as:
- The number of projects you can efficiently work through within a given amount of time (by week, quarter or billing cycle.)
- The number of email follow-ups, reminders or Boomerangs sent across by individual team members or groups to collaborate and gather feedback.
- History of revision timestamps within Google Docs or other content management and collaboration systems.
- How long emails are sitting in team members’ inboxes unread.
- The average time it takes a reviewer to view a creative piece from that time it was sent.
- How many times a deadline for feedback is missed across projects.
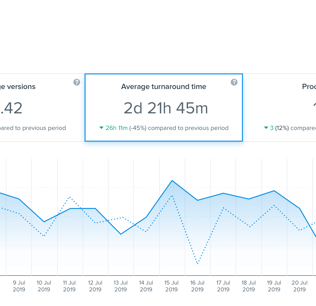
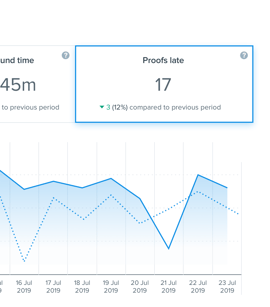
Tracking how the average turnaround time for actionable tasks and the frequency of missed deadlines fluctuates over time is critical to understanding your team's capacity.
Pulling these metrics manually can be a full-time job in and of itself. Instead, a capable online proofing system can automate this analysis by tracking project progress with notifications, access controls, and engagement rates with content proofs and comments.
2. The Total Volume of Project Versions
Measuring project completion timelines may track your project velocity, but the number of versions within those timelines quickly show where bottlenecks live. This includes:
- Concepting: How many concepts did you initially pitch to a client?
- Initial Draft: How many attempts does it take to get a project ready for review?
- Revisions/Comments: Are later drafts still generating a lot of comments and change requests, potentially veering project scope off course?
- Final Version(s): How long does it take creative teams and stakeholders to sign off on a finished product? Is late-breaking feedback often coming from left field? If so, why?
Why Track Version Counts?
Looking at project revisions across a variety of dimensions (comparing teams, clients, end-result media form, etc.) can give you another key insight into capacity planning. Tracking revision effort helps to determine:
- If project scopes and timelines are well-defined with all parties from the start of a project (requiring fewer revisions.)
- If action items are dispersed accurately and clearly across team members (requiring fewer comments and follow-up)
- Which creative teams that run into the most challenges implementing feedback, either due to incomplete review or poor internal collaboration abilities (requiring more comments and feedback later in the game)
- Which stakeholders provide incomplete or feedback throughout the review process (requiring more rework.)
- In the agency world, which clients tend to provide incomplete project scopes or changing requirements (often requiring your team to start all over.)
Getting project drafts right to hinge on the abilities of your creative team in some regard, but it’s also a broader reflection of how effective feedback can be given, understood, and implemented at every stage of the creation and revision process. It helps you identify if and where quality needs to be baked into the creative process earlier and faster.
Measuring the number of project revisions goes beyond just adding up all the different named versions of project files. It’s really a post-mortem project measure of total revision effort, including:
- The number of concepts that were pitched to a client or stakeholder.
- How many times a reviewer provided feedback on an earlier version because they didn’t have the most current version.
- How many document merges your team had to do (or manually update) across different content versions.
- The number of emails or chat logs required to send project versions for review.
- The total number of versions created before it is “Approved.”
Measuring Version Counts
Attempting to measure project revisions by tallying up email communication and file shares is basically a wild goose chase: you’ll usually end up discovering that feedback was often provided against superseded versions, or that someone worked on a file on a local drive to make changes that weren’t shared with the group or factored into the revision timeline.
This can be overcome with an online proofing system that offers robust version management and embedded markups and comments, so you’re not having to hunt down all the ways revisions are communicated and implemented.
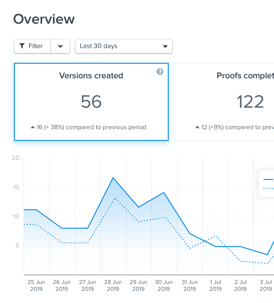
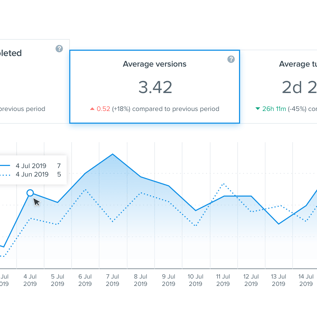
Measuring version creation with online proofing can help expose the most feedback-intensive projects or periods for your team.
3. Process Management Costs
Beyond production timelines and revision volume, the cost of managing the creative process is also ripe for improvement. The time put into the manual steps of managing a creative project to completion goes beyond headcount and salaries and can be less straightforward to assess. It includes the full lifecycle of the project, including:
- Project Management: How many times are project managers creating and sending emails to notify team members that projects are ready for review or new versions?
- Client Management: How many reminder emails and IMs getting people to review the content.
- Document Management: How often are project managers toggling between systems to keep projects up to do, ensure revisions are made and comparing files and versions because they aren’t in one place?
Why Track Process Management Costs?
It’s simple: Any time wasted, administrative or otherwise, is money wasted. Creative project management is a delicate balance between high-value work like setting and maintaining priorities and ensuring smooth communication and basic tasks that come out of those needs, like scheduling, file sharing, and deadline setting.
By tracking the full-scale of this work, project management teams can:
- Identify routine work that can be automated with a better, centralized review and approval system.
- Free up team members’ time to work on more impactful work, such as generating new business or preparing creative briefs.
- Take low-to-no-value tasks out of the creative supply chain entirely.
How to Measure Process Management
Project oversight is a bit harder to quantify in numbers, but the time sinks are clearly visible to those who are hands-on in ensuring projects move along a set path. Start by reviewing:
- How many emails and chats need to be sent to notify team members that projects are ready for review?
- How many hours are spent on assign tasks and follow-up with creative team members on their work?
- How many systems are used to manually collecting and collating feedback into one place for revision, and what’s the total cost of redundant systems?
- How many hours are spent updating statuses within project management systems, reports, or project documents?
Many of the extraneous project management time costs can be solved with a centralized proofing and review system that cuts down on the back and forth facilitation of communication, review, and revisions. Consider where these time costs live and how consolidated technology can ease the routine tasks your project management encounters across project types and clients.
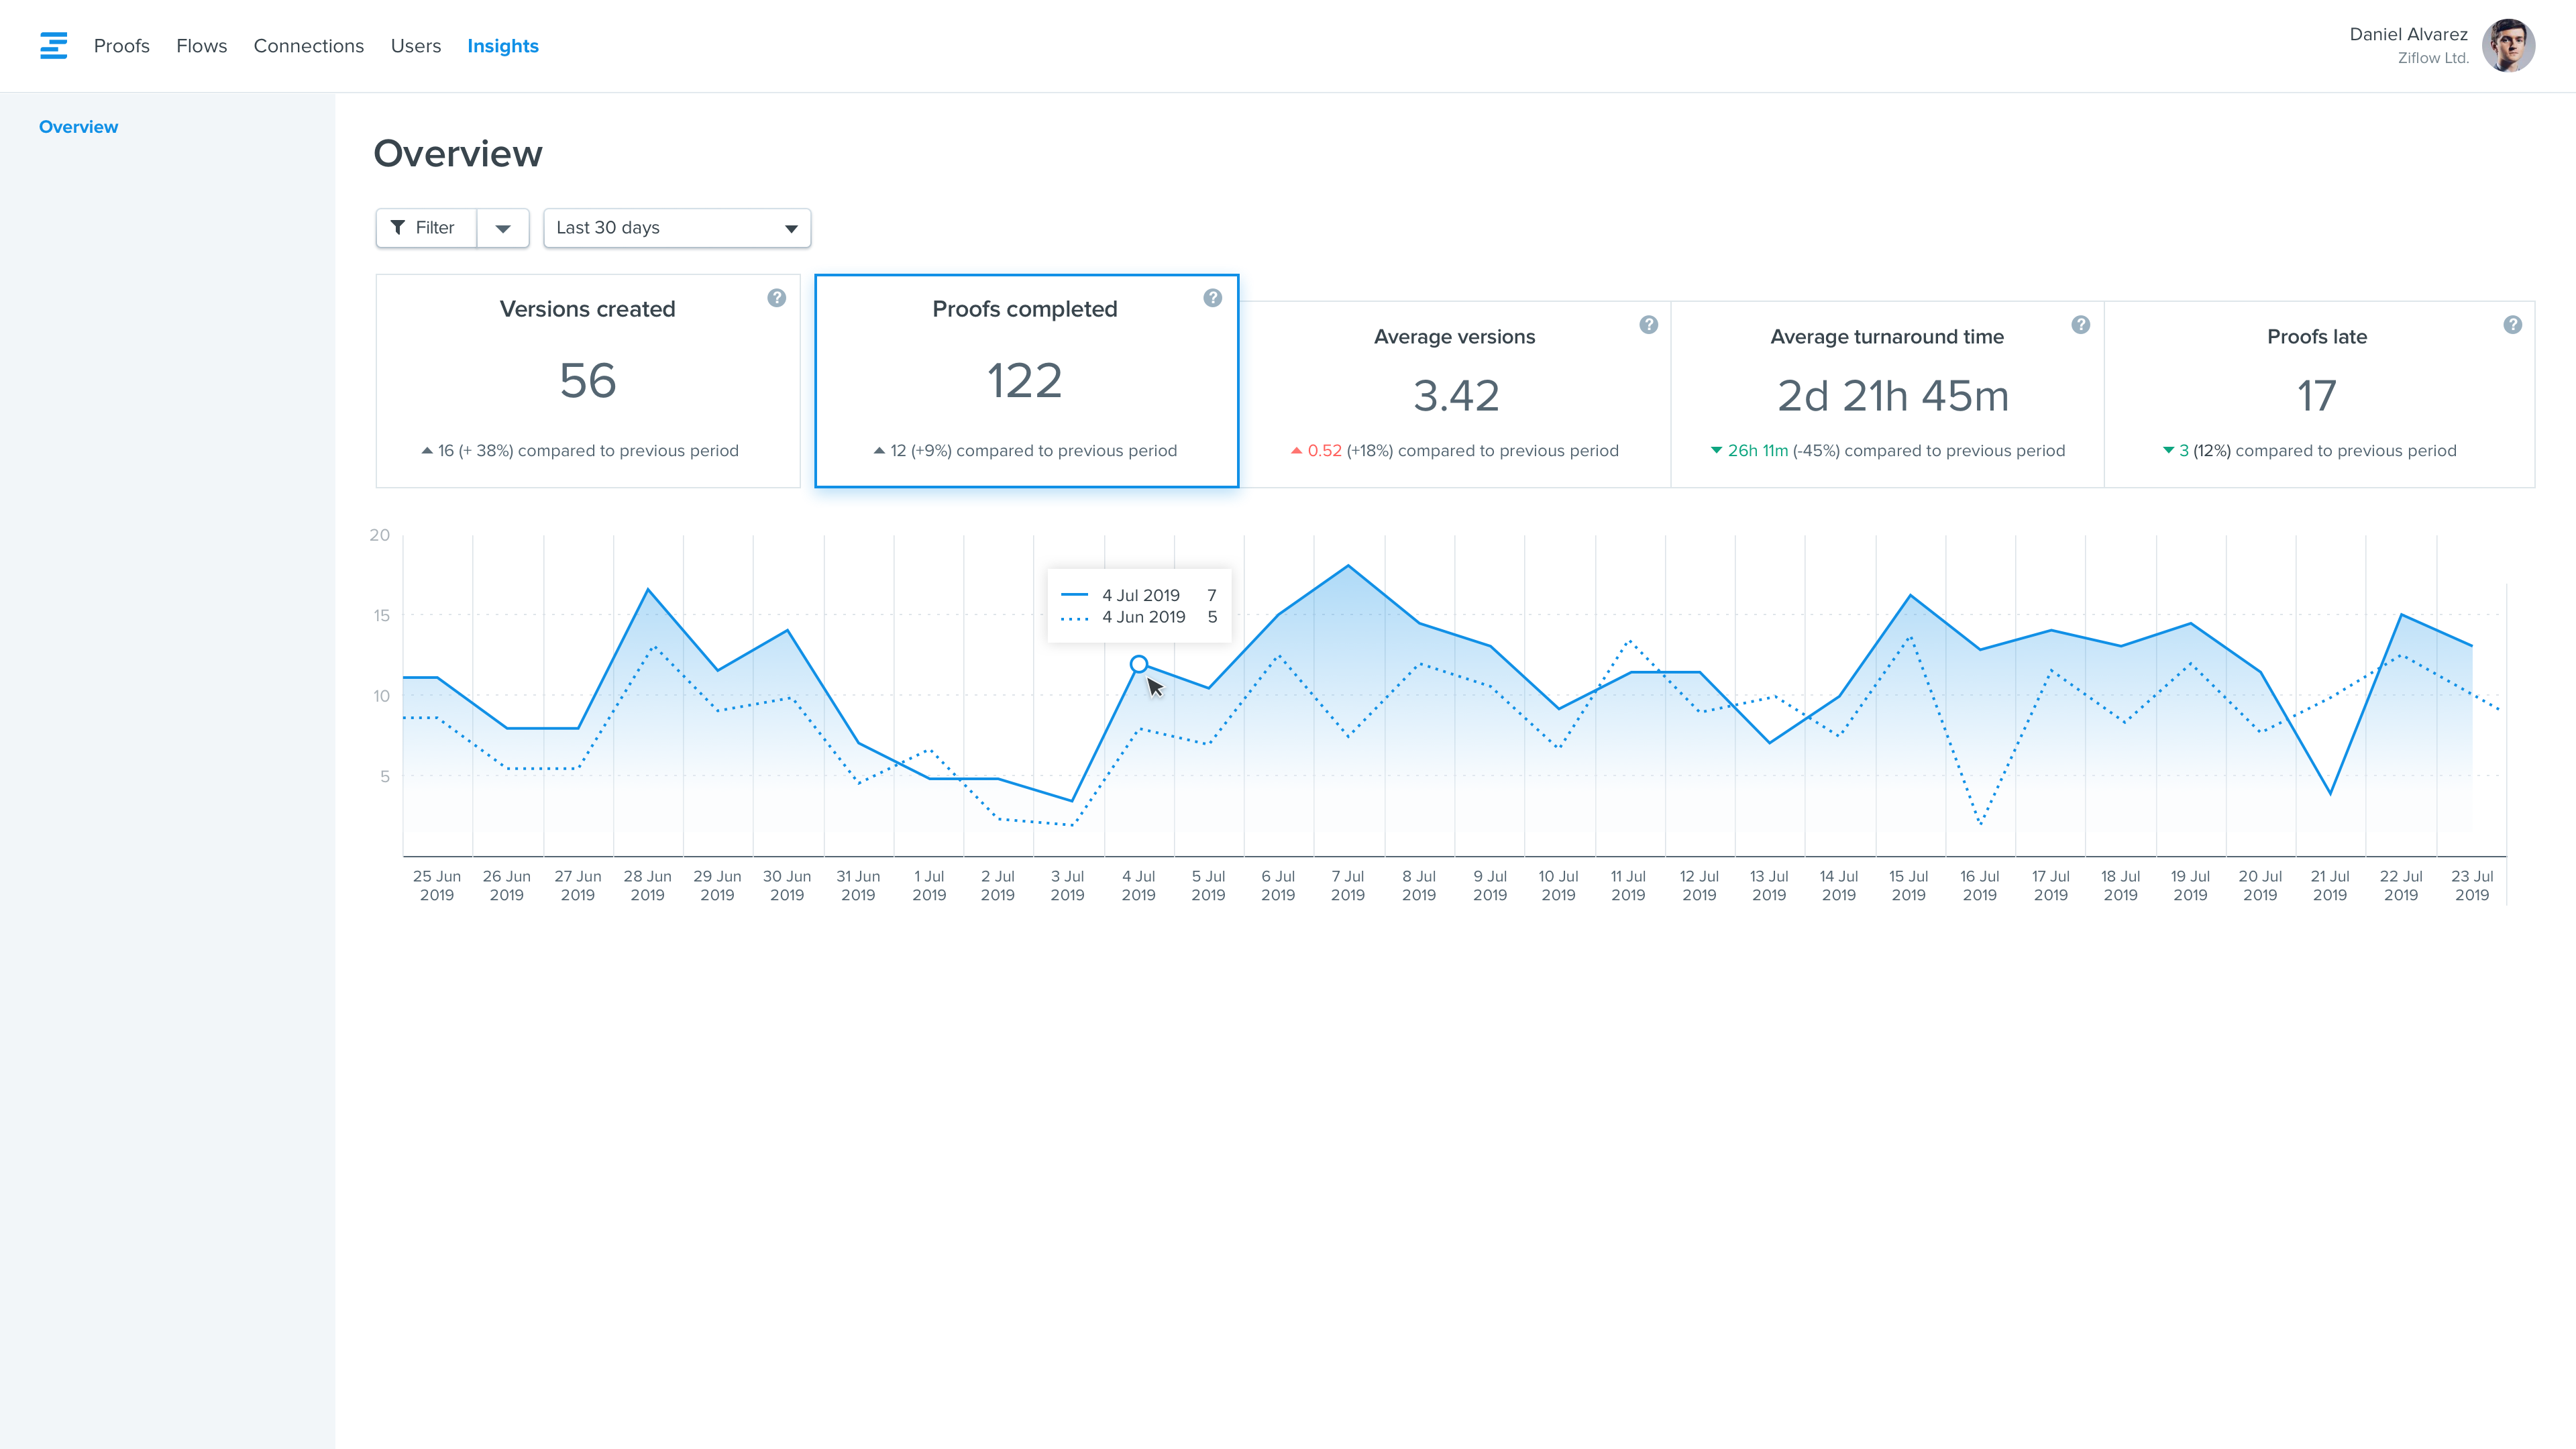
Understand the true health of your review processes with a comprehensive metrics dashboard.
Making the Case for Creative Marketing Metrics
Determining the average numbers for each of these creative marketing metrics depends on the type of organization and team size. How your team stacks up is less about industry averages and more about establishing a historical baseline of output and the right measures of progress for your specific team.
The key is to implement a system that can track and identify areas for improvement without requiring your team to stop the high-value work they’re already doing to gather those analytics.
See how Ziflow delivers creative production metrics around content review and approval efficiency.


